It is 11 PM on a Thursday. The founder of a 14-person logistics company is still at her desk, pasting numbers from three different spreadsheets into a PowerPoint deck for Friday’s investor call. Stripe. QuickBooks. A custom delivery tracker her dev built in 2021. None of them talk to each other. The report she will present tomorrow morning already reflects data that is four days old.
She is not behind. She is not disorganised. She is doing exactly what thousands of SME owners around the world do every single week — manually bridging the gap between where their data lives and where decisions actually get made.The gap is getting wider. And the cost of crossing it manually is no longer invisible.
The Real Problem with Manual Financial Reporting
Most small business owners do not think of manual reporting as a crisis. It feels like “just part of running the business.” But when you add it up — the hours spent copying data between tools, the delayed decisions made on stale numbers, the errors introduced by human formatting — the picture changes quickly.
The problem compounds in three specific ways:
- Lag: By the time a report is assembled, the underlying numbers have moved. Decisions get made on history, not reality.
- Error accumulation: Each manual step — copy, paste, format, calculate — introduces a new surface for mistakes. A misaligned cell in one sheet cascades across six others.
- Bottleneck dependency: When the one person who “knows how the spreadsheet works” goes on holiday, reporting stops entirely.
This is not a technology problem that appeared recently. But for the first time, the technology to solve it is affordable, deployable, and genuinely within reach for businesses with fewer than 50 employees.
What Is an Intelligent Financial Dashboard?
An intelligent financial dashboard is not just a prettier spreadsheet. The distinction matters.
A traditional dashboard is a visualisation layer. You pour data in, it displays charts out. You still have to manually pull the data, clean it, and decide what to display. The intelligence is human.
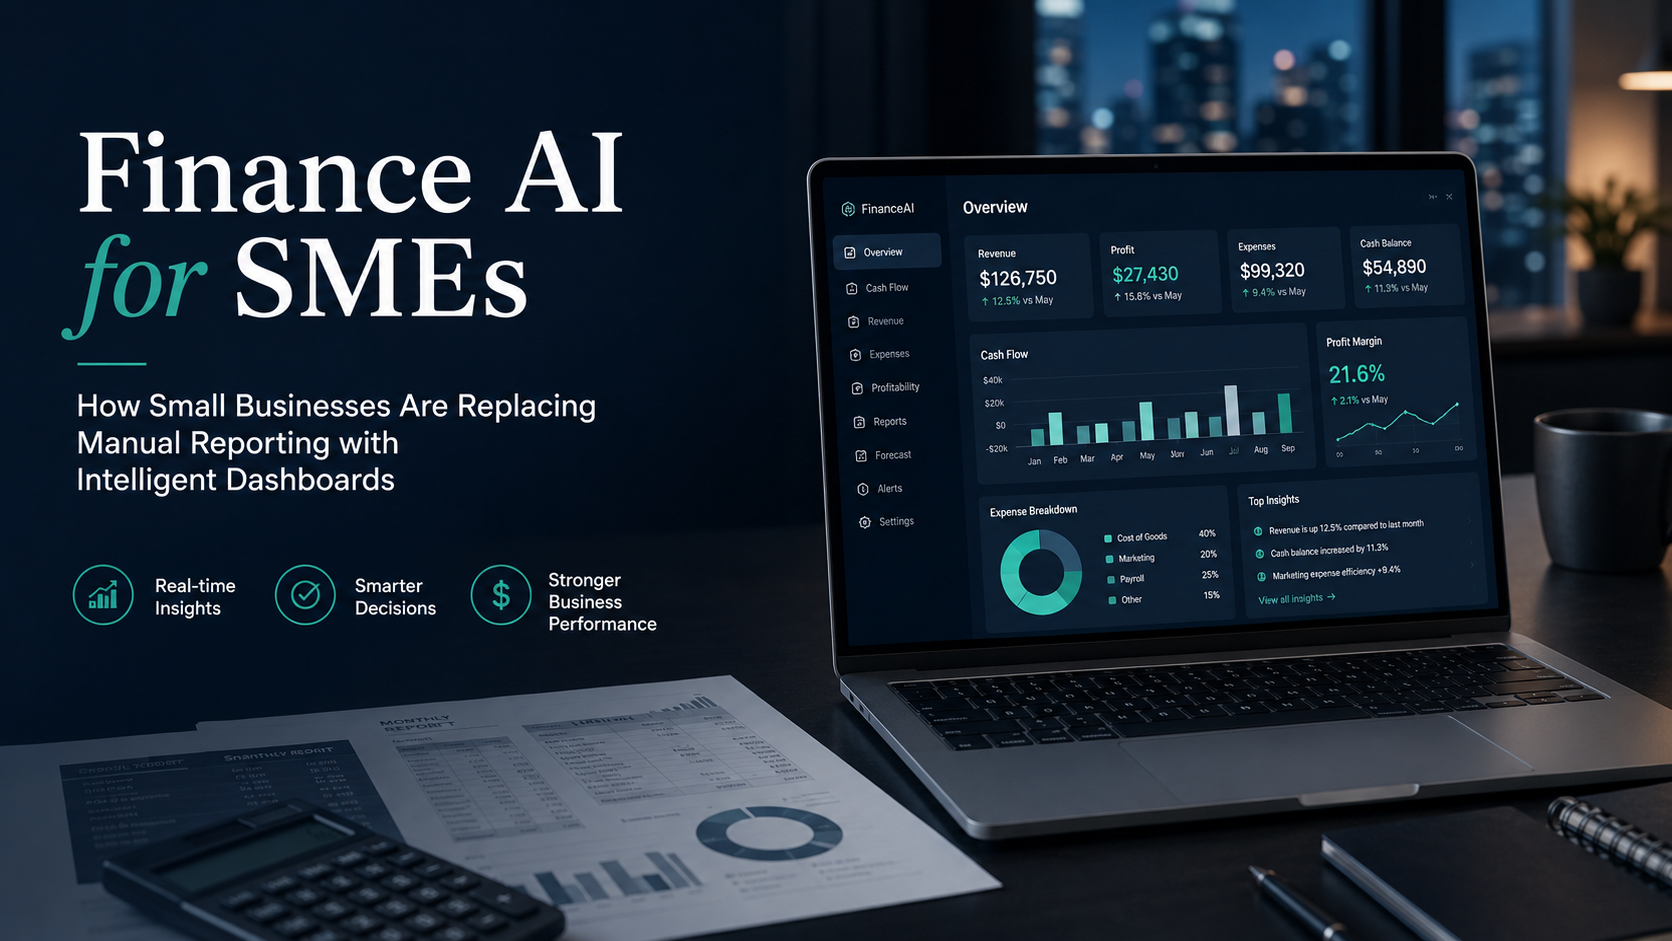
An intelligent dashboard — one powered by AI and connected data pipelines — does something fundamentally different. It pulls data automatically from every source your business uses, normalises it in real time, surfaces patterns and anomalies without being asked, and presents not just what happened but what is likely to happen next.
Think of it this way: a traditional dashboard is a window. An intelligent dashboard is a co-pilot with a window.
The technologies that make this possible are no longer confined to enterprise-scale deployments:
- Automated ETL pipelines — Extract, Transform, Load processes that continuously pull data from APIs (Stripe, Xero, QuickBooks, Shopify, HubSpot, and dozens more) and consolidate it into a single clean data layer.
- Machine learning anomaly detection — Algorithms that learn your normal operating patterns and flag deviations: an unusual spike in refunds, a cash flow shortfall approaching in 11 days, a vendor payment that processed twice.
- Natural language querying — The ability to type “show me gross margin by product line for Q1 vs Q2” and receive an answer in seconds, without writing a single formula.
- Predictive forecasting — Models trained on your historical data that project forward: runway, revenue trends, seasonal demand shifts, and staffing cost trajectories.
None of this requires a data science team. The infrastructure exists. The missing piece, for most SMEs, is someone who can connect the dots between your specific tools and a system built around how your business actually works.
Three SME Use Cases Where AI Dashboards Changed the Numbers
1. A Retail E-commerce Brand — Cutting Reporting Time by 83%
A UK-based fashion retailer with 22 employees was spending 12 hours every week producing a consolidated performance report across Shopify, Google Ads, and their 3PL warehouse system. Reports were produced on Mondays, reflecting the previous week — creating a structural delay baked into every decision.
After deploying an integrated AI dashboard with real-time API connections to all three platforms, weekly reporting time dropped to under 2 hours. Ad spend decisions shifted from weekly to daily — with a measurable 18% improvement in ROAS within the first quarter of operation.
2. A Professional Services Firm — Catching a Cash Flow Crisis Before It Hit
A 9-person legal consultancy in Singapore was managing cash flow through a manually updated Excel model reviewed at month-end board meetings. A predictive AI dashboard, integrated with their billing system and bank feeds, surfaced a projected cash shortfall 34 days in advance — caused by three large invoices clustering in the same month as quarterly tax obligations.
With 34 days of lead time, the firm restructured two payment terms and arranged a short-term facility. No emergency borrowing was needed. Without the forward-looking model, the same situation would have been discovered with fewer than 5 days to respond.
3. A Manufacturing SME — Replacing Three Roles of Manual Work
A Canadian manufacturer with 40 employees across two sites had a part-time bookkeeper, an external accountant, and the operations director all contributing to a monthly management accounts pack. Consolidating data from their ERP, payroll system, and two separate bank accounts took the better part of a week and cost approximately $4,800/month in combined labour.
An AI-connected dashboard reduced that monthly consolidation to an automated overnight process. The bookkeeper was redeployed to accounts receivable follow-up. The external accountant’s hours were cut by 60%. Monthly reporting cost fell to under $1,100.
What Manual Reporting Is Actually Costing You
The direct labour cost is the most visible line item. But it is rarely the largest one.
| Cost Type | Typical Annual Impact (10–50 person SME) |
|---|---|
| Staff time on data consolidation | $18,000 – $45,000 |
| Delayed decisions on stale data | 5–15% revenue leakage (often unquantified) |
| Errors caught late (reconciliation, audits) | $3,000 – $20,000 per incident |
| Competitive disadvantage during market shifts | Hard to price; high strategic cost |
| Auditor/accountant overtime for clean-up | $5,000 – $15,000 per year |
The total cost of manual reporting is almost always significantly higher than the cost of replacing it. The barrier is not economics — it is awareness and implementation complexity.
Off-the-Shelf vs. Custom: What Should SMEs Actually Build?
Most businesses start by looking at platforms: Tableau, Power BI, Metabase, Looker Studio. These tools are powerful. They are also general-purpose — designed to work with any business, which means they are optimised for none in particular.
Off-the-Shelf Works When
- Data already lives in a clean, standard format
- You have an analyst or BI developer in-house
- Reporting needs are relatively stable
- You only need visualisations, not AI insights
Custom Is Better When
- Tools don’t have native integrations with each other
- You need forward-looking predictions, not just charts
- You want anomaly alerts or natural language querying
- You’re scaling and can’t keep rebuilding every 18 months
The answer for most growing SMEs is a hybrid: purpose-built data pipelines and AI logic sitting underneath a clean, custom-designed interface — not a generic BI tool configured to approximate what you actually need.
Common Mistakes SMEs Make When Adopting Finance AI
Connecting data before cleaning it
Garbage in, garbage out applies here more than anywhere else. An AI model trained on inconsistently categorised expenses or duplicate invoice records will surface confident-sounding nonsense. Data hygiene must come first.
Expecting out-of-the-box insight from generic tools
A standard Power BI template will show you charts. It will not tell you that your Q3 margin compression is driven by a 14% increase in returns from one specific fulfilment partner. That level of specificity requires your data model to reflect your business model.
Building for today, not for 12 months from now
SMEs frequently scope dashboards around current reporting needs and then outgrow them within a year. Systems that cannot accommodate new data sources or evolving KPIs become liabilities rather than assets.
Ignoring user adoption
A dashboard that finance understands but operations will not open is not a dashboard — it is a report that costs more to produce. Design for the people who actually need to make decisions.
Treating AI outputs as infallible
Predictive models are probabilistic, not prescient. Teams need training to interpret outputs critically, not to trust them blindly.
Underinvesting in ongoing data connections
APIs change. SaaS platforms update their schemas. A dashboard that is not actively maintained will silently break — showing stale or incorrect data while appearing to function normally.
How Webygraphy Builds Financial Intelligence Systems for SMEs
At Webygraphy, we have spent the past several years building AI-connected data solutions for businesses that are serious about replacing guesswork with clarity. We are not a BI tool reseller. We are the team that sits with your finance lead, maps your actual data landscape, and builds something that fits the way your business runs — not the way a product roadmap assumes it should.
Our approach to intelligent financial dashboards typically covers:
- Data audit and source mapping — understanding exactly what you have, where it lives, and what state it is in before a single line of infrastructure is built
- Custom ETL pipeline development — automated connectors between your specific tools, built to handle edge cases in your actual data, not theoretical clean data
- AI layer integration — anomaly detection, predictive forecasting, and natural language querying tuned to your KPIs and business model
- Dashboard design and UX — interfaces built for the people who use them, not the people who built the underlying system
- Ongoing support and evolution — because a financial intelligence system that does not adapt to your growth is one you will need to replace
We work with SMEs across the UK, Europe, North America, and the Asia-Pacific region. The problems are strikingly consistent regardless of geography: disconnected tools, manual consolidation, decisions made too slowly on numbers that are already old. The solutions are specific to each business.
Frequently Asked Questions
Do we need a large data set before an AI dashboard is useful?
No. Even businesses with 12 to 18 months of transactional history can generate meaningful predictive models. The key is data consistency, not volume.
How long does it take to deploy an intelligent financial dashboard?
For a typical SME with three to five data sources, a functional first version can be live in four to eight weeks. More complex environments with legacy systems or data quality challenges take longer — we will give you an honest timeline after the discovery call.
Will this work with the tools we already use?
In almost all cases, yes. Modern accounting platforms (Xero, QuickBooks, Sage), payment processors (Stripe, PayPal, Square), e-commerce platforms (Shopify, WooCommerce, Magento), and CRMs (HubSpot, Salesforce) all expose APIs. If your tool has an API, it can be connected.
Is this only relevant for businesses with a dedicated finance team?
No — in fact, the businesses that benefit most are often those where the founder or operations director is doing finance themselves. Reducing their reporting burden frees them to focus on running the business.
What is the difference between this and just using QuickBooks or Xero reporting?
Built-in accounting software reports are limited to data that lives within that platform. An intelligent dashboard aggregates data from every source your business touches and applies AI logic that goes beyond what any single platform can offer.
Can the dashboard send alerts rather than requiring us to log in and check?
Yes. Proactive alerting — via email, Slack, or other channels — is one of the highest-value features. You should not have to remember to check a dashboard; the dashboard should reach you when something needs attention.
How does pricing typically work for a custom solution?
Scope varies significantly, but most SME-scale projects fall in the range of a mid-level hire’s monthly salary for a few months of build time — and then deliver ongoing savings that significantly exceed that investment. We provide transparent scoping and cost breakdown after the discovery phase.
Is our financial data secure when it passes through an AI system?
Security architecture is a central part of every engagement, not an afterthought. We design data pipelines with access controls, encryption in transit and at rest, and clear data residency policies appropriate to your regulatory environment (GDPR for UK/EU, relevant frameworks for other markets).
What happens if we grow and need more data sources added?
Systems we build are designed to scale. Adding a new data source is a discrete integration task, not a rebuild. We build with extensibility in mind from the start.
We have tried a BI tool before and it never got used — why would this be different?
Because a generic BI tool requires you to adapt your questions to its structure. A custom solution is built around the questions your team actually asks. Adoption is fundamentally a design problem, and it is one we treat as seriously as the engineering.